
Social media marketing might look like nothing but pretty pictures and quirky captions on the surface, but dig a little deeper and you’ll be amazed at the strategy behind the content brands put out.
And that strategy pays off. Over 130 million users engage with shopping posts every month on Instagram alone. With a solid social media strategy, you can build an audience of people ready to buy from your brand.
To get there, you’re going to need a good roster of social media metrics to track. In this post, we’re going over the only 9 social media metrics you need to knock it out of the park on social media. Let’s get started.
Why are social media metrics important?
Social media marketing without goals is essentially throwing content at the internet and hoping something sticks. Trial and error is an essential part of social media marketing, but it becomes a headache really fast when not guided by goals and metrics.
Setting goals for your social media marketing places intent behind your actions. It ensures that your content is worth something to your company by making sure it actually reaches and resonates with your target audience.
Social media metrics are a vital part of setting goals, as they measure the success of your campaigns and show you how close you are to reaching those goals.
With social media metrics, you can gauge how effective your content is at driving traffic to your site and even develop an understanding of what content results in the most conversions.
Social media metrics are also helpful when it comes to convincing others that your social media marketing decisions are having a positive impact on the business’s overall success.
The social media metrics you need to measure
Here are the most important social media metrics you need to measure, split into categories based on the goals they help you improve on:
Engagement
Engagement metrics gauge the effectiveness of your campaigns by measuring how involved your audience is with your content. These are the metrics that show how much and how often users interact with your social media content. The higher your engagement rates, the better your audience health (this term designates an audience with responsive, “real” followers).

So, how do you track engagement? Here are the 3 main engagement metrics you should be tracking:
Interactions (likes, comments, retweets, etc.)
These are the individual actions users take when engaging with your content. They’re usually recorded per post, so you might have to add them up to find the number of interactions for a given time period.
Post engagement rate
This measures the average engagement rate per post. You can calculate this by adding up the number of engagements and dividing them by impressions or reach. This judges the number of people who interacted with your post divided by the number of people who saw it, showing how many people found your post interesting enough to engage with.
Account mentions
Account mentions are organic mentions that aren’t part of a reply. Usually, these mentions occur when a user tags a brand in their story. Tracking account mentions is a form of social listening. It’s a good way to measure brand awareness. Most social media marketing software options that include analytics let you track account mentions easily.
Awareness
Raising brand awareness is one major benefit of social media. To get the most out of the content you put out, you need to measure your brand awareness. The best way to do so? Reach and impressions.

Reach
Reach is the number of unique users who’ve seen your content. It’s most affected by the timing of your posts and the content you’re putting out. Studying this metric can help you narrow down what content resonates with your target audience and when.
Additionally, you can track your potential reach. This shows how many people could potentially see your post during a certain period of time. Tracking your potential reach can help you measure your progress when it comes to expanding your overall audience.
Impressions
Impressions measure the number of times your content was seen. This metric lets you know how much potential your content has for organic visibility on social media.
These two metrics are easily confused. The key difference is that reach only counts how many users see your content, while impressions can measure how many times your content was seen in general, including when the content was shown to users who’d already seen it once.
In addition to measuring brand awareness by gauging how many eyes are on your content, measuring reach and impressions can also inform your content strategy. For example, if your reach or impressions are high and your engagement rate is low, your content is being seen but not interacted with. This indicates that your content isn’t interesting enough for your audience, so you need to make some adjustments.
Share of voice
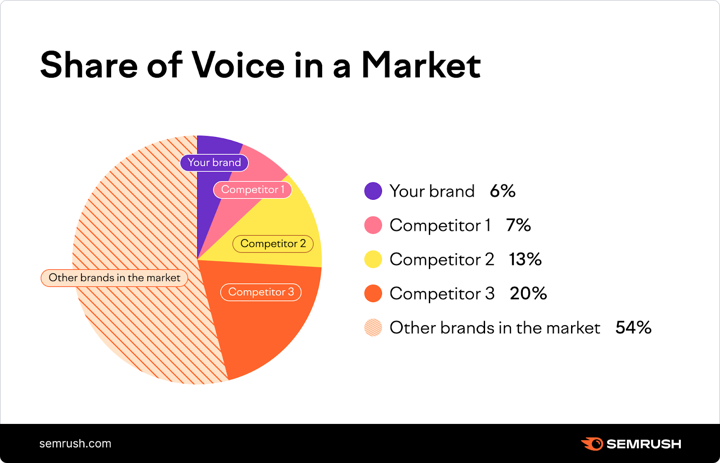
Share of voice is a way to judge how many people are talking to your brand in comparison to your competitors. This metric relies on social listening to track the discussion of certain keywords related to your brand.
You can also see what words are most often associated with your brand. This helps you not only measure how much people are talking about your brand, but also how they are perceiving it. Plus, a brand’s share of voice tends to correlate with its share of the market and revenue. With that in mind, you’ll want to track and improve your own.
Share of voice
You can track share of voice manually or using social media marketing tools. Keep in mind that you’ll still need a social listening tool to calculate manually.
Here’s the formula: (number of mentions of your brand/total number of brand mentions (yours + your competitors’) x 100 = SOV.
Use a social listening tool (Social Searcher is a good free one) to count the number of mentions for your brand and your competitors.
More advanced social media marketing software options will yield more accurate results, but this is a good place to start.
ROI
ROI (return on investment) is a super important metric for companies with websites and e-commerce platforms to track. If you want to know how your social media marketing efforts are affecting your revenue, ROI metrics are the way to go. They track the flow of users from social media accounts to your website and show how social referral traffic affects overall conversions.
You can track these metrics using Google Analytics. Some social media marketing platforms link directly to your Google Analytics account to streamline this process.

Referrals
Referrals are how users get to your website. You can find this metric in your web analytics, where referral traffic will be divided into sources. The source you’ll want to pay attention to here is “social”. You can also track the click-through rate on individual social media posts, but analyzing referral traffic in your web analytics gives you an overview of how much traffic is coming from social media in a given time period.
Conversions
The conversion rate is the percentage of visitors who clicked a link in your post then performed an action like subscribing to your newsletter, downloading gated content, registering for an event, or making a purchase. A high conversion rate indicates the content you’re putting out is compelling to your audience.
You can calculate the conversion rate by creating a post with a call-to-action link, placing a cookie on the user’s device, and using campaign reporting tools to track the clicks and conversions that result from the post. You can find the conversion rate by dividing the number of conversions by the total number of clicks.
Customer care
After tracking metrics that show how your customers perceive your brand, you might be wondering how to sway that perception in your favor. That’s where the customer care metric comes in. If you want your customers to think fondly of your brand, you need to treat them with care. This is why we track response rate and time.

Response rate and time
This metric tracks how long it takes your team to respond to important messages, as well as how many messages your team is responding to. While most social media analytics platforms track this metric for you, you can track it manually like this: messages you responded to/total messages received * 100.
To calculate response time, simply take the average time it took you to respond to all messages in a given time period.
When you make a conscious effort to track this metric and improve your customer care, you’ll likely see improvement in other areas like brand awareness and share of voice.
What next?
Now that you know what metrics you need to track for an awesome social media marketing strategy, it’s time to put them into action. You don’t have to track everything at once. To start slowly, simply pick a few of the metrics most relevant to your current business goals. Set a goal for how much progress you want to make by the end of the month, then get to posting your strategic content.